[ad_1]
A few days ago I gave a short talk on the subject. I was partly inspired by a little comment made at a seminar, roughly “of course we all know that if prices are sticky, higher nominal rates raise higher real rates, that lowers aggregate demand and lowers inflation.” Maybe we “know” that, but it’s not as readily present in our models as we think. This also crystallizes some work in the ongoing “Expectations and the neutrality of interest rates” project.
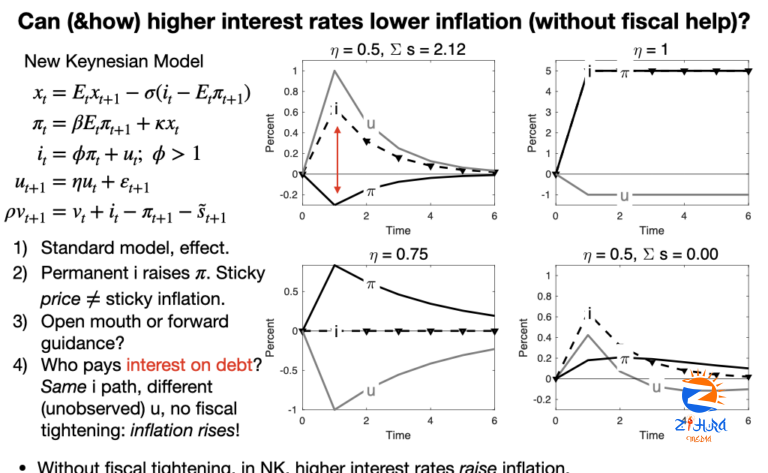
The equations are the utterly standard new-Keynesian model. The last equation tracks the evolution of the real value of the debt, which is usually in the footnotes of that model.
OK, top right, the standard result. There is a positive but temporary shock to the monetary policy rule, u. Interest rates go up and then slowly revert. Inflation goes down. Hooray. (Output also goes down, as the Phillips Curve insists.)
The next graph should give you pause on just how you interpreted the first one. What if the interest rate goes up persistently? Inflation rises, suddenly and completely matching the rise in interest rate! Yet prices are quite sticky — k = 0.1 here. Here I drove the persistence all the way to 1, but that’s not crucial. With any persistence above 0.75, higher interest rates give rise to higher inflation.
What’s going on? Prices are sticky, but inflation is not sticky. In the Calvo model only a few firms can change price in any instant, but they change by a large amount, so the rate of inflation can jump up instantly just as it does. I think a lot of intuition wants inflation to be sticky, so that inflation can slowly pick up after a shock. That’s how it seems to work in the world, but sticky prices do not deliver that result. Hence, the real interest rate doesn’t change at all in response to this persistent rise in nominal interest rates. Now maybe inflation is sticky, costs apply to the derivative not the level, but absolutely none of the immense literature on price stickiness considers that possibility or how in the world it might be true, at least as far as I know. Let me know if I’m wrong. At a minimum, I hope I have started to undermine your faith that we all have easy textbook models in which higher interest rates reliably lower inflation.
(Yes, the shock is negative. Look at the Taylor rule. This happens a lot in these models, another reason you might worry. The shock can go in a different direction from observed interest rates.)
Panel 3 lowers the persistence of the shock to a cleverly chosen 0.75. Now (with sigma=1, kappa=0.1, phi= 1.2), inflation now moves with no change in interest rate at all. The Fed merely announces the shock and inflation jumps all on its own. I call this “equilibrium selection policy” or “open mouth policy.” You can regard this as a feature or a bug. If you believe this model, the Fed can move inflation just by making speeches! You can regard this as powerful “forward guidance.” Or you can regard it as nuts. In any case, if you thought that the Fed’s mechanism for lowering inflation is to raise nominal interest rates, inflation is sticky, real rates rise, output falls and inflation falls, well here is another case in which the standard model says something else entirely.
Panel 4 is of course my main hobby horse these days. I tee up the question in Panel 1 with the red line. In that panel, the nominal interest are is higher than the expected inflation rate. The real interest rate is positive. The costs of servicing the debt have risen. That’s a serious effect nowadays. With 100% debt/GDP each 1% higher real rate is 1% of GDP more deficit, $250 billion dollars per year. Somebody has to pay that sooner or later. This “monetary policy” comes with a fiscal tightening. You’ll see that in the footnotes of good new-Keynesian models: lump sum taxes come along to pay higher interest costs on the debt.
Now imagine Jay Powell comes knocking to Congress in the middle of a knock-down drag-out fight over spending and the debt limit, and says “oh, we’re going to raise rates 4 percentage points. We need you to raise taxes or cut spending by $1 trillion to pay those extra interest costs on the debt.” A laugh might be the polite answer.
So, in the last graph, I ask, what happens if the Fed raises interest rates and fiscal policy refuses to raise taxes or cut spending? In the new-Keynesian model there is not a 1-1 mapping between the shock (u) process and interest rates. Many different u produce the same i. So, I ask the model, “choose a u process that produces exactly the same interest rate as in the top left panel, but needs no additional fiscal surpluses.” Declines in interest costs of the debt (inflation above interest rates) and devaluation of debt by period 1 inflation must match rises in interest costs on the debt (inflation below interest rates). The bottom right panel gives the answer to this question.
Review: Same interest rate, no fiscal help? Inflation rises. In this very standard new-Keynesian model, higher interest rates without a concurrent fiscal tightening raise inflation, immediately and persistently.
Fans will know of the long-term debt extension that solves this problem, and I’ve plugged that solution before (see the “Expectations” paper above).
The point today: The statement that we have easy simple well understood textbook models, that capture the standard intuition — higher nominal rates with sticky prices mean higher real rates, those lower output and lower inflation — is simply not true. The standard model behaves very differently than you think it does. It’s amazing how after 30 years of playing with these simple equations, verbal intuition and the equations remain so far apart.
The last two bullet points emphasize two other aspects of the intuition vs model separation. Notice that even in the top left graph, higher interest rates (and lower output) come with rising inflation. At best the higher rate causes a sudden jump down in inflation — prices, not inflation, are sticky even in the top left graph — but then inflation steadily rises. Not even in the top left graph do higher rates send future inflation lower than current inflation. Widespread intuition goes the other way.
In all this theorizing, the Phillips Curve strikes me as the weak link. The Fed and common intuition make the Phillips Curve causal: higher rates cause lower output cause lower inflation. The original Phillips Curve was just a correlation, and Lucas 1972 thought of causality the other way: higher inflation fools people temporarily to producing more.
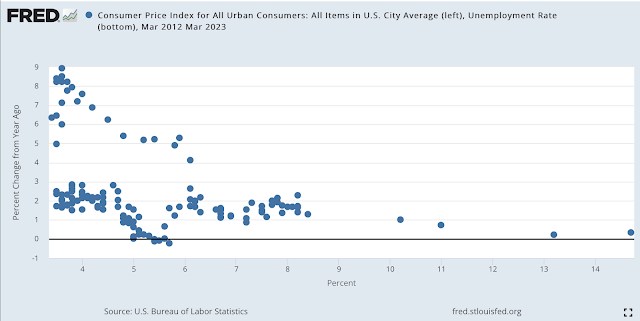
Here is the Phillips curve (unemployment x axis, inflation y axis) from 2012 through last month. The dots on the lower branch are the pre-covid curve, “flat” as common wisdom proclaimed. Inflation was still 2% with unemployment 3.5% on the eve of the pandemic. The upper branch is the more recent experience.
I think this plot makes some sense of the Fed’s colossal failure to see inflation coming, or to perceive it once the dragon was inside the outer wall and breathing fire at the inner gate. If you believe in a Phillips Curve, causal from unemployment (or “labor market conditions”) to inflation, and you last saw 3.5% unemployment with 2% inflation in February 2021, the 6% unemployment of March 2021 is going to make you totally ignore any inflation blips that come along. Surely, until we get well past 3.5% unemployment again, there’s nothing to worry about. Well, that was wrong. The curve “shifted” if there is a curve at all.
But what to put in its place? Good question.
[ad_2]

